This website uses cookies to ensure you get the best experience on our website.


- Table of Contents
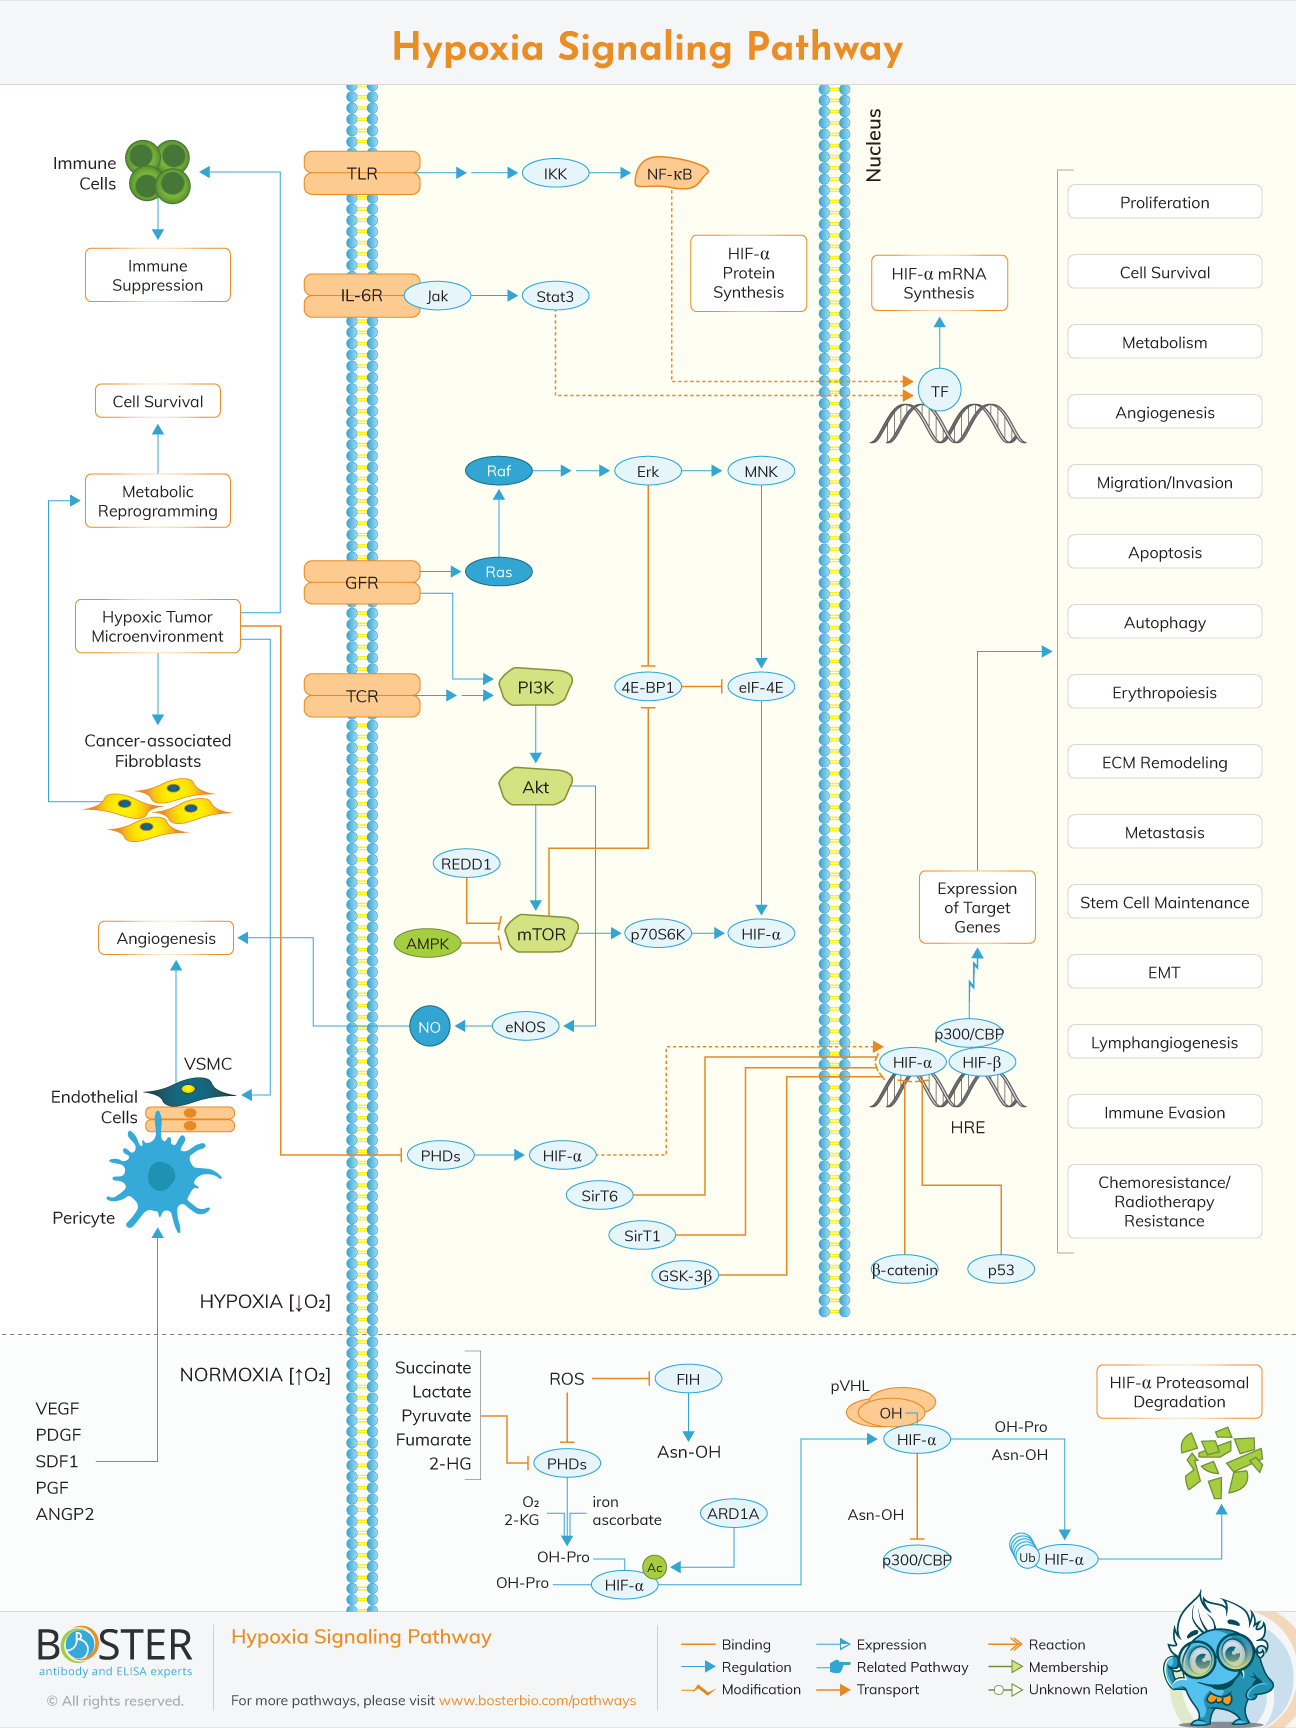
Interactive enrichment-driven map — HIF-α stability, angiogenesis, metabolism
Build your antibody bundle ↓| Target | SKU | Reactivity | Application | Size | Check Please select at least 4 targets. |
|---|---|---|---|---|---|
| TLR4 (TLR) | A00017-2 | Human | WB, Flow Cytometry, ELISA | 100μg | |
| IL6R (IL-6R) | A01425-1 | Human | WB | 100μg | |
| EGFR (GFR) | A00023 | Human | Flow Cytometry, IHC, WB | 100μg | |
| CD3E (TCR) | A02765-1 | Mouse, Rat | ELISA, IHC, WB, Flow Cytometry | 100μg | |
| IKBKB (IKK) | PA2036-1 | Human, Mouse, Rat | WB | 100μg | |
| NFKB1 (NF-kB) | PA2111 | Human, Mouse, Rat | IHC, WB | 100μg | |
| JAK1 (Jak) | A00330 | Human, Mouse, Rat | WB | 100μg | |
| STAT3 | PB9511 | Human, Mouse, Rat | Flow Cytometry, IF, IHC, ICC, WB | 100μg | |
| HRAS (Ras) | A00114 | Human, Mouse, Rat | WB | 100μg | |
| RAF1 (Raf) | A00446-1 | Human, Mouse, Rat | Flow Cytometry, WB | 100μg | |
| MAPK1 (Erk) | PA1049 | Rat, Mouse, Human | Flow Cytometry, IF, ICC, WB | 100μg | |
| MKNK1 (MNK) | No PicoBand® antibody for this target — null | ||||
| PIK3CA (PI3K) | PB9314 | Human | Flow Cytometry, WB | 100μg | |
| AKT1 (Akt) | No PicoBand® antibody for this target — null | ||||
| DDIT4 (REDD1) | AZQ7T346 | Zebrafish | WB | 100μg | |
| MTOR (mTOR) | A00003-2 | Human, Monkey | ELISA, IHC, WB | 100μg | |
| PRKAA1 (AMPK) | A00994-3 | Human, Mouse, Rat | ELISA, WB | 100μg | |
| RPS6KB1 (p70S6K) | A01475-2 | Human, Mouse | WB, Flow Cytometry | 100μg | |
| EIF4EBP1 (4E-BP1) | A00968-1 | Human, Mouse, Rat | WB, IHC, Flow Cytometry | 100μg | |
| EIF4E (eIF-4E) | A00135-1 | Human, Mouse, Rat | WB, ICC, IF, Flow Cytometry, ELISA | 100μg | |
| NOS3 (eNOS) | A01604-2 | Human, Mouse, Rat | ELISA, Flow Cytometry, IHC, WB | 100μg | |
| EGLN1 (PHDs) | A00415-1 | Human, Mouse, Rat | WB, IP, Flow Cytometry | 100μg | |
| HIF1A (HIF-a) | A00013-1 | Human | ELISA, WB | 100μg | |
| HIF1B (HIF-b) | No PicoBand® antibody for this target — null | ||||
| HIF1AN (FIH) | A02116-2 | Human, Mouse, Rat | WB, Flow Cytometry, ELISA | 100μg | |
| VHL (pVHL) | A00079-3 | Human, Mouse, Rat | WB, IHC, ICC, IF, Flow Cytometry, ELISA | 100μg | |
| NAA10 (ARD1A) | No PicoBand® antibody for this target — null | ||||
| EP300 (p300/CBP) | A00117 | Human, Mouse | Flow Cytometry, IF, IHC, ICC, WB | 100μg | |
| SIRT1 (SirT1) | A00018-1 | Human | ELISA, IF, ICC, WB | 100μg | |
| SIRT6 (SirT6) | A00611-3 | Human | ELISA, Flow Cytometry, IF, ICC, WB | 100μg | |
| GSK3B (GSK-3b) | A00791-3 | Human, Mouse, Rat | ELISA, IF, IHC, ICC, WB | 100μg | |
| CTNNB1 (b-catenin) | A00004 | Human, Mouse, Rat | ELISA, Flow Cytometry, IF, IHC, ICC, WB | 100μg | |
| TP53 (p53) | A00001-2 | Human | WB, IHC, Flow Cytometry, ELISA | 100μg | |
| VEGFA (VEGF) | A00045 | Mouse, Rat | WB | 100μg | |
| PDGFA (PDGF) | A02257-1 | Human, Mouse, Rat | WB, ICC, IF, ELISA | 100μg | |
| CXCL12 (SDF1) | A00053-1 | Mouse, Rat | IHC, WB | 100μg | |
| PGF | A01164-1 | Mouse, Rat | ELISA, WB | 100μg | |
| ANGPT2 (ANGP2) | A00370 | Human | ELISA (Cap), IHC, WB | 100μg | |
The hypoxia signaling pathway is a conserved cellular program that activates when oxygen levels drop below normal. Rather than shutting down, cells mount a coordinated transcriptional response that rewires metabolism, promotes new blood vessel formation, and adjusts immune activity to survive under stress.
At the center of this response are the hypoxia-inducible factors (HIFs) — heterodimeric transcription factors made up of an oxygen-regulated HIF-α subunit (HIF-1α, HIF-2α, or HIF-3α) and a constitutively expressed HIF-1β subunit. When oxygen is plentiful, HIF-α is continuously produced and rapidly destroyed. When oxygen is scarce, that destruction is blocked, and HIF-α accumulates, enters the nucleus, and switches on hundreds of target genes.
Understanding the hypoxia-inducible factor pathway is foundational for research in oncology, nephrology, cardiovascular biology, and any setting where tissue oxygenation is clinically relevant.
What every researcher should know before designing a hypoxia experiment.
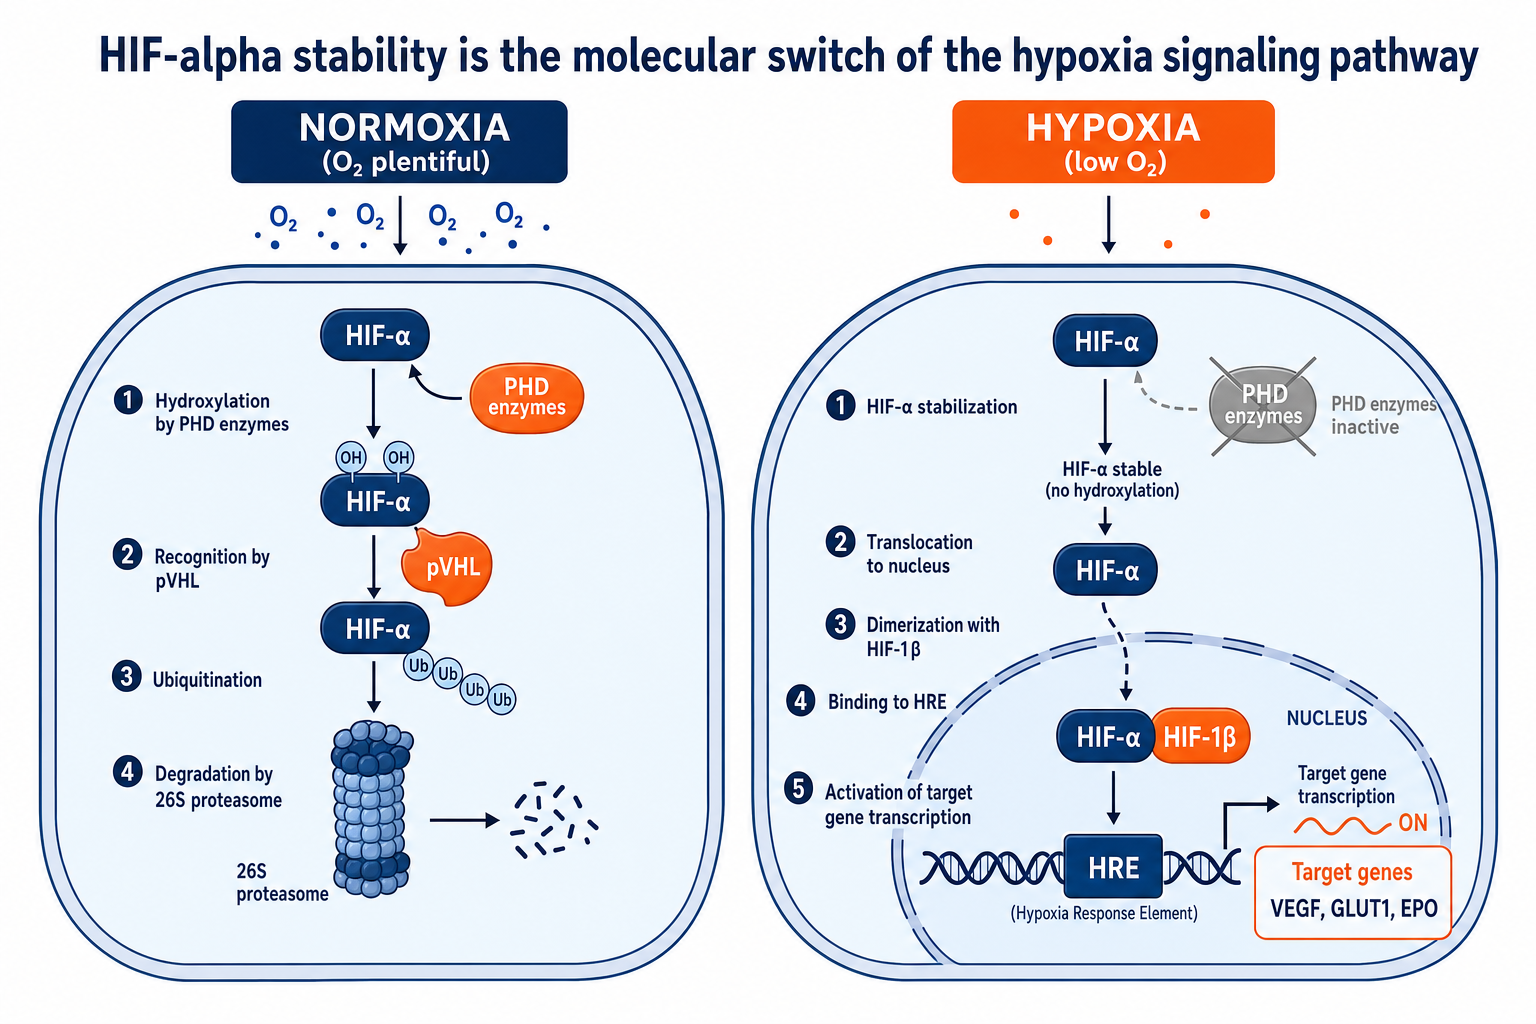
PHD enzymes require molecular oxygen to function. When oxygen drops, PHD activity stalls, HIF-α accumulates, and the entire transcriptional program activates. Oxygen is the molecular on/off switch for the hypoxia-inducible factor pathway.
A single HIF complex transactivates a broad transcriptional network including VEGF, GLUT1, LDHA, EPO, PDGF-B, and dozens of metabolic and immune modulators. The breadth of this response is why hypoxia signaling is relevant across so many disease areas.
HIF-1α and HIF-2α have overlapping but distinct target gene sets. Cell type, oxygen dose, duration of hypoxia, and co-existing pathway activity (mTOR, NF-κB) all shape the output. Always consider which HIF isoform is dominant in your model system.
The HIF-1 signaling pathway is primarily controlled at the protein level through oxygen-dependent hydroxylation. Two enzyme families act as the primary oxygen sensors:
| Condition | PHD Activity | HIF-α Status | Outcome |
|---|---|---|---|
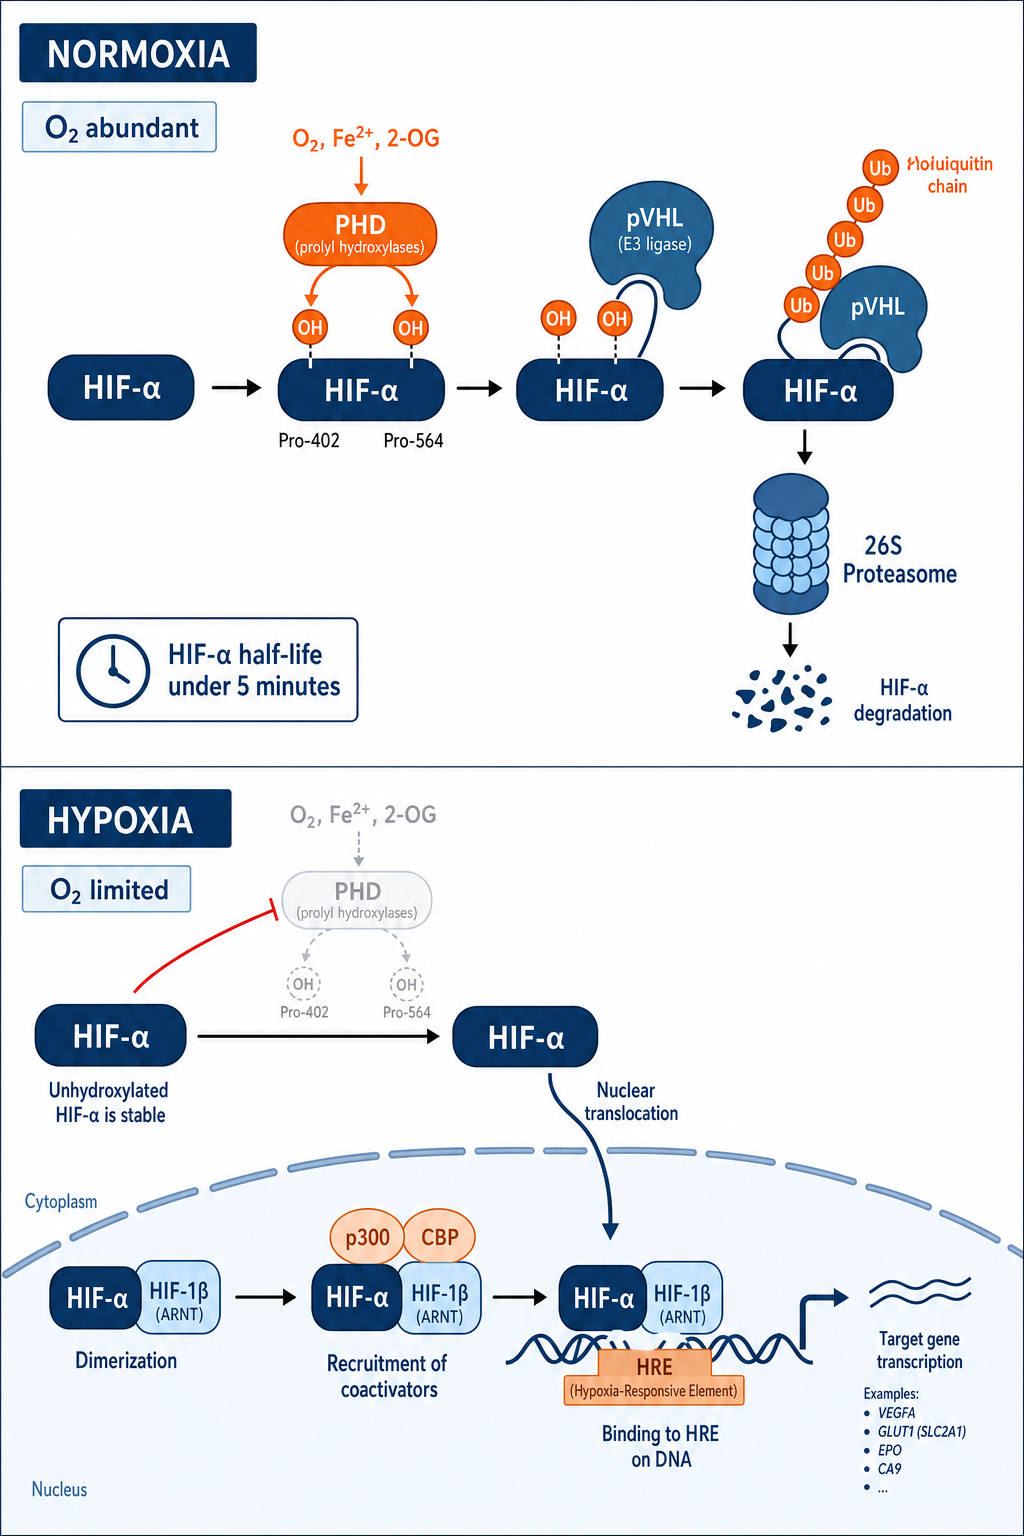
| Normoxia (>5% O₂) | Active | Hydroxylated on Pro-402 / Pro-564 | VHL binds, ubiquitination, 26S proteasomal degradation |
| Hypoxia (<2% O₂) | Inhibited (O₂ limiting) | Stable, unhydroxylated | Nuclear translocation, HIF-β dimerization, HRE binding, target gene transcription |
| Normoxia (FIH axis) | FIH hydroxylates Asn-803 | Blocked from p300/CBP binding | Partial transcriptional repression even if HIF-α escapes PHD degradation |
Under normoxia, prolyl-4-hydroxylases (PHDs) modify HIF-α on conserved proline residues. This creates a docking site for the von Hippel-Lindau protein (pVHL), an E3 ubiquitin ligase that tags HIF-α for rapid proteasomal degradation. The entire half-life of HIF-α protein under normoxia is under five minutes.
Under hypoxia, PHDs cannot function (they require molecular oxygen as a co-substrate). HIF-α accumulates, dimerizes with HIF-1β, and the complex binds hypoxia-responsive elements (HREs) in the promoters of target genes. Co-activators p300 and CBP complete the transactivation complex.
This PHD/VHL/HIF axis is the best-validated drug target in the pathway. HIF prolyl hydroxylase inhibitors (PHD inhibitors, also called hypoxia-inducible factor drugs) are now approved for treatment of anemia in chronic kidney disease by stabilizing HIF-α to stimulate erythropoietin production.
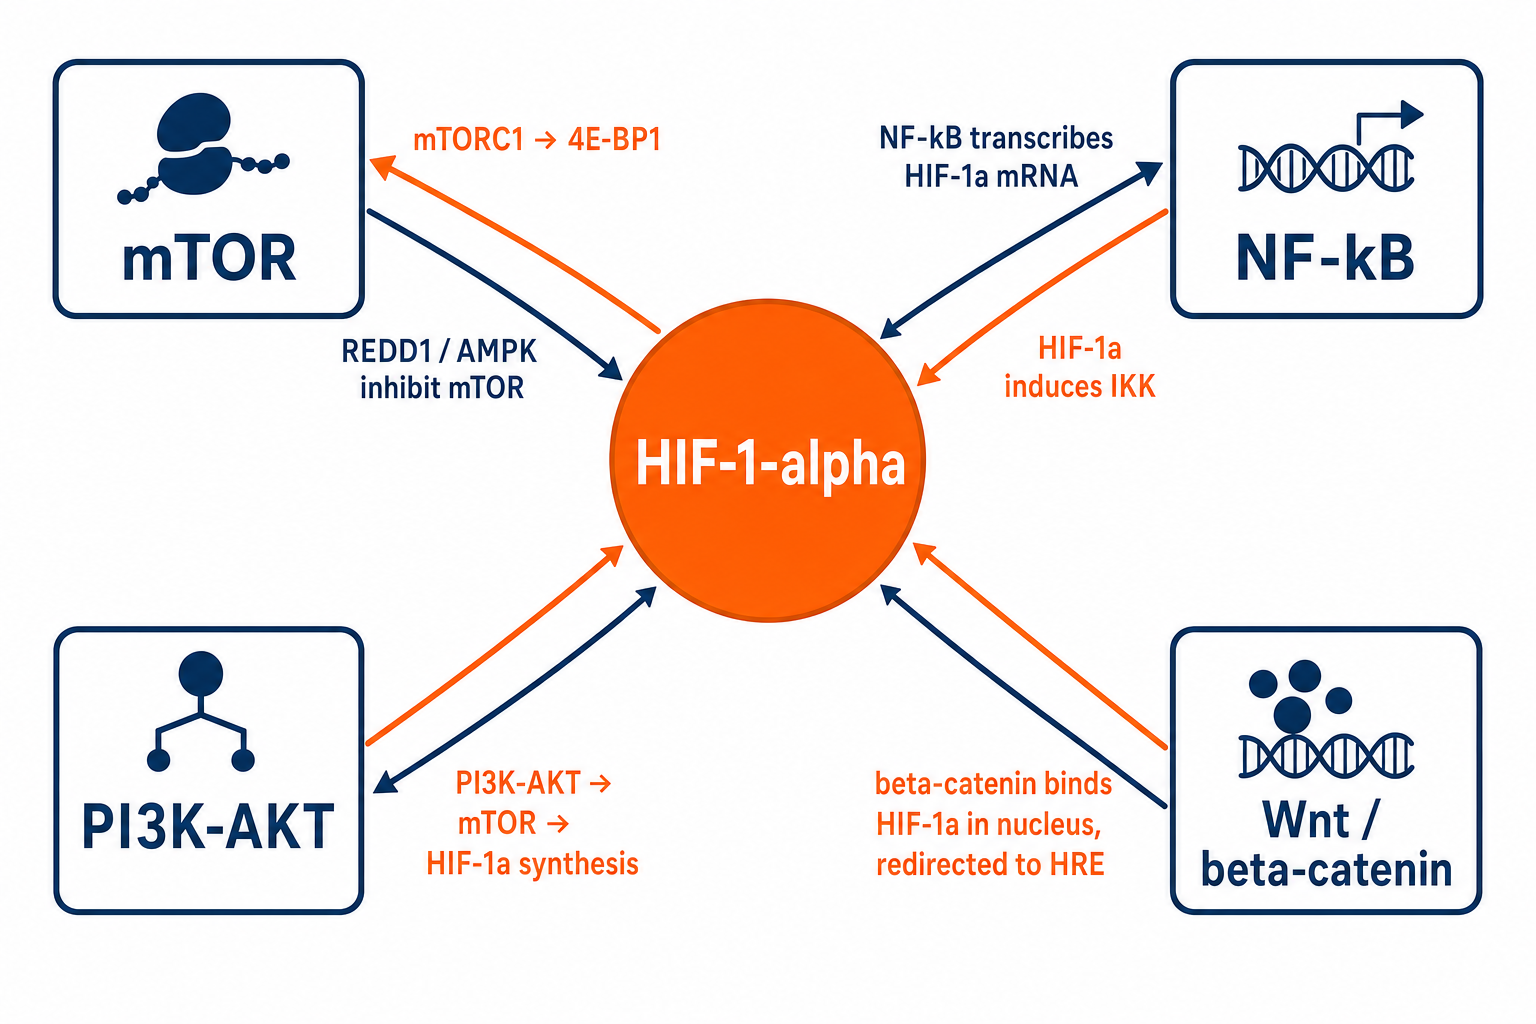
Hypoxia signaling does not operate in isolation. The HIF pathway is deeply integrated with the major growth and survival signaling axes your cells use. Understanding these connections prevents misinterpretation of experimental results and opens new therapeutic angles.
mTOR complex 1 (mTORC1) directly phosphorylates 4E-BP1 to increase HIF-1α mRNA translation. Hypoxia reciprocally inhibits mTORC1 via REDD1 and AMPK to conserve energy. This creates a bimodal relationship: early hypoxia sees HIF boosted by mTOR; sustained hypoxia suppresses mTOR to reduce energetically expensive anabolic processes. Rapamycin and its analogs (rapalogs) reduce HIF-1α protein levels in tumor cells, partly explaining their anti-angiogenic effects.
NF-κB directly transcribes HIF-1α mRNA, boosting the basal pool available for stabilization under hypoxia. Conversely, HIF-1α supports NF-κB activity by inducing IKK. This mutual amplification loop is particularly relevant in solid tumors and inflammatory hypoxia, where both pathways converge to drive immune evasion, angiogenesis, and survival. Inhibiting one arm without addressing the other often leads to compensatory rebound.
PI3K-AKT signaling enhances HIF-1α synthesis through mTOR and also directly phosphorylates FOXO transcription factors, releasing HIF-1α from additional repressive controls. Oncogenic PI3K mutations (common in breast, colorectal, and endometrial cancers) chronically elevate HIF-1α levels even in normoxia, creating a pseudo-hypoxic state that drives VEGF and glycolytic gene expression without oxygen deprivation.
β-catenin physically interacts with HIF-1α in the nucleus under hypoxia. This interaction redirects β-catenin from Wnt target gene promoters to HREs, reprogramming the transcriptional output of both pathways simultaneously. In colorectal and hepatocellular carcinoma models, this Wnt-HIF cross-regulation coordinates stem cell maintenance with hypoxia adaptation and is an emerging co-targeting strategy.
The same HIF machinery produces profoundly different physiological outcomes depending on which cell type is hypoxic. Here are the most experimentally relevant tissue contexts.
The HIF-1 signaling pathway in cancer is one of the most studied areas in tumor biology. Solid tumors rapidly outgrow their blood supply, creating regions of profound hypoxia. This activates HIF, which:
Tumor hypoxia measured by HIF target expression (e.g., CA9, GLUT1) is an independent negative prognostic marker across multiple cancer types.
The hypoxia-inducible factor in CKD and kidney biology is a major translational focus. The kidney is exquisitely sensitive to oxygen tension. In CKD:
Hypoxia inducible factor kidney research is now a distinct translational subdiscipline with its own biomarker set and drug pipeline.
Myocardial infarction, stroke, and peripheral vascular disease all produce acute ischemic hypoxia. HIF coordinates the endogenous repair response:
Therapeutic HIF activation (preconditioning) is actively investigated as a cardioprotective strategy.
Hypoxia signaling is a driver of fibrotic remodeling across multiple organs:
The endocrine system — adrenal, thyroid, pituitary — is increasingly recognized as a central site of hypoxia pathway dysregulation.
Tumor hypoxia does not only affect cancer cells themselves. HIF-α exerts broad effects across every cell type in the tumor microenvironment (TME), fundamentally reshaping the immune landscape and stromal architecture.
Tumor hypoxia measured by HIF target gene signatures (e.g., CA9, GLUT1, LDHA, VEGFA) is independently associated with poor response to chemotherapy, radiotherapy, and immune checkpoint blockade. Spatial profiling of hypoxia gradients within tumors is an active area of translational research.
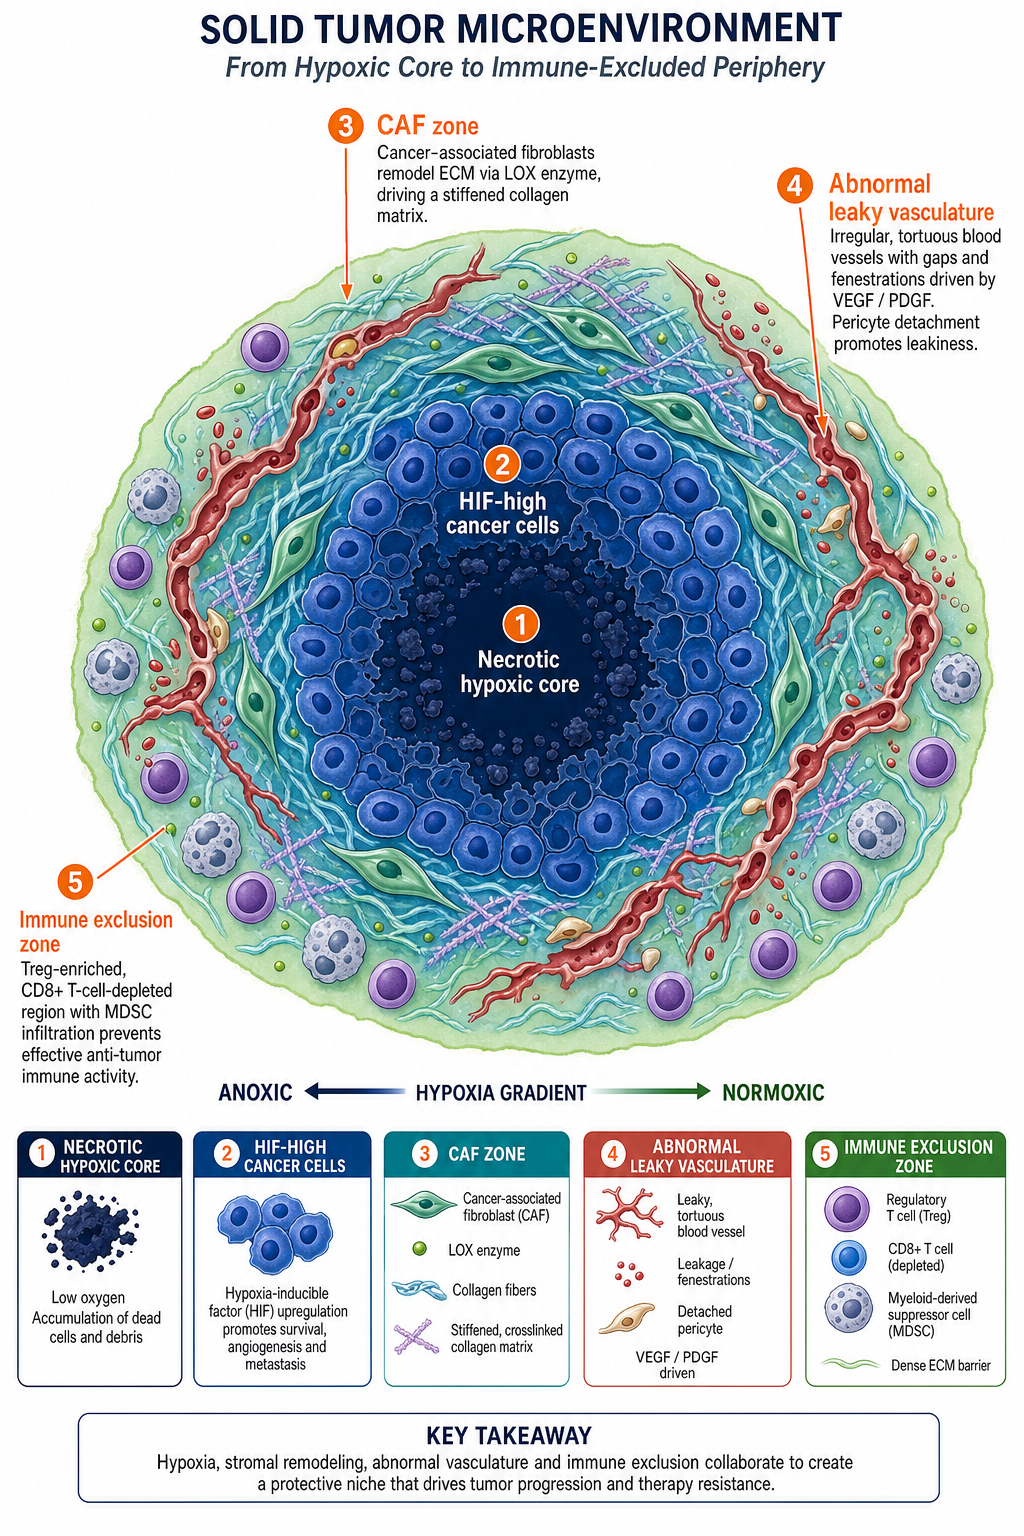
Selecting the right readout for your hypoxia experiment requires knowing which gene belongs to which functional node of the pathway. The table below maps key hypoxia signaling pathway components to their function, standard detection method, and experimental context.
| Gene / Protein | Pathway Node | Function | Common Detection Method |
|---|---|---|---|
| HIF-1α (HIF1A) | Master regulator | Central transcription factor; stabilized under hypoxia | Western blot, IHC, ELISA |
| HIF-2α (EPAS1) | Master regulator | EPO regulation in kidney; dominant in chronic hypoxia | Western blot, IHC |
| VHL | Oxygen sensor | E3 ligase adapter; loss = constitutive HIF activation | Sequencing, Western blot, IHC |
| PHD2 (EGLN1) | Oxygen sensor | Primary HIF hydroxylase; main PHD isoform in most tissues | Western blot, activity assay |
| VEGFA | Angiogenesis | Endothelial cell proliferation and migration; angiogenesis | ELISA, IHC, qPCR |
| CA9 (Carbonic Anhydrase IX) | Hypoxia marker | HIF-1α target; pH regulation; reliable in situ hypoxia marker | IHC, ELISA, flow cytometry |
| GLUT1 (SLC2A1) | Metabolic reprogramming | Glucose uptake; upregulated to fuel glycolysis | Western blot, IHC, qPCR |
| LDHA | Metabolic reprogramming | Lactate dehydrogenase A; converts pyruvate to lactate | Western blot, activity assay, ELISA |
| EPO (Erythropoietin) | Erythropoiesis | Hypoxia-inducible factor and erythropoietin; RBC production | ELISA (serum/urine) |
| PDGF-B | Angiogenesis / Stroma | Pericyte recruitment; vascular remodeling | ELISA, IHC |
When designing a hypoxia experiment, CA9 and GLUT1 are the most reliable surrogate IHC markers for active HIF transcription in tissue sections. For functional readouts in cell culture, VEGF secretion measured by ELISA serves as an accessible downstream output. For mechanistic studies, PHD2 activity assays or co-immunoprecipitation of VHL with HIF-1α provide direct evidence of pathway regulation at the oxygen-sensing step.
Common questions from researchers working with the hypoxia signaling pathway.
The hypoxia signaling pathway is the cellular mechanism by which cells sense and respond to low oxygen. It centers on hypoxia-inducible factors (HIFs) — transcription factors that are continuously degraded in normoxia and rapidly stabilized when oxygen drops. Once stable, HIF drives expression of hundreds of genes involved in angiogenesis, metabolism, immune modulation, and cell survival.
For research purposes, it is relevant across oncology, nephrology, cardiovascular biology, hematology, and infectious disease. Understanding which arm of the pathway is active in your model — and which HIF isoform is dominant — is essential for interpreting experimental results correctly.
Both HIF-1α and HIF-2α (encoded by EPAS1) are oxygen-regulated alpha subunits of the HIF complex, but they have distinct target gene preferences and expression patterns.
HIF-1α is ubiquitously expressed and dominates the acute transcriptional response to hypoxia. It primarily drives glycolytic genes (GLUT1, LDHA), inflammatory mediators, and early VEGF induction. HIF-2α is enriched in vascular endothelium, type II pneumocytes, and renal interstitial fibroblasts. It preferentially drives erythropoietin (EPO), OCT4 (stem cell maintenance), and certain VEGF isoforms. In chronic hypoxia, HIF-2α often replaces HIF-1α as the dominant isoform due to differential mRNA stability and translational control. PHD inhibitors approved for CKD anemia primarily work through HIF-2α stabilization in renal fibroblasts.
The HIF-1 signaling pathway KEGG map is catalogued under entry hsa04066 (Homo sapiens). It is freely accessible at the KEGG PATHWAY database (genome.jp/kegg/pathway.html). The KEGG map covers the canonical PHD/VHL oxygen-sensing axis, HIF-1α/HIF-1β dimerization and HRE binding, and major downstream branches including angiogenesis (VEGF), metabolism (GLUT, LDHA, PDK1), iron metabolism (TFRC), and proliferation (TGF-α, IGF2).
KEGG also provides gene-level annotations with links to disease associations and drug targets, making it a useful starting reference for designing targeted gene expression panels or interpreting RNA-seq pathway enrichment results.
Hypoxia-inducible factor drugs approved or in late-stage development fall into two main categories:
Additional HIF pathway drugs in development include VEGF pathway inhibitors (anti-angiogenics like bevacizumab), which target a downstream consequence of HIF activation rather than HIF itself.
The approach depends on your experimental system and the depth of mechanistic insight you need:
Tumor hypoxia is one of the most consistently identified negative prognostic factors across solid tumor types. Chemoradioresistance arises through several HIF-dependent mechanisms:
Multiple clinical studies have validated tumor hypoxia gene signatures (including CA9, GLUT1, HIF-1α IHC scores) as independent predictors of reduced overall survival and progression-free survival in cervical, head and neck, breast, and lung cancers.