This website uses cookies to ensure you get the best experience on our website.


- Table of Contents
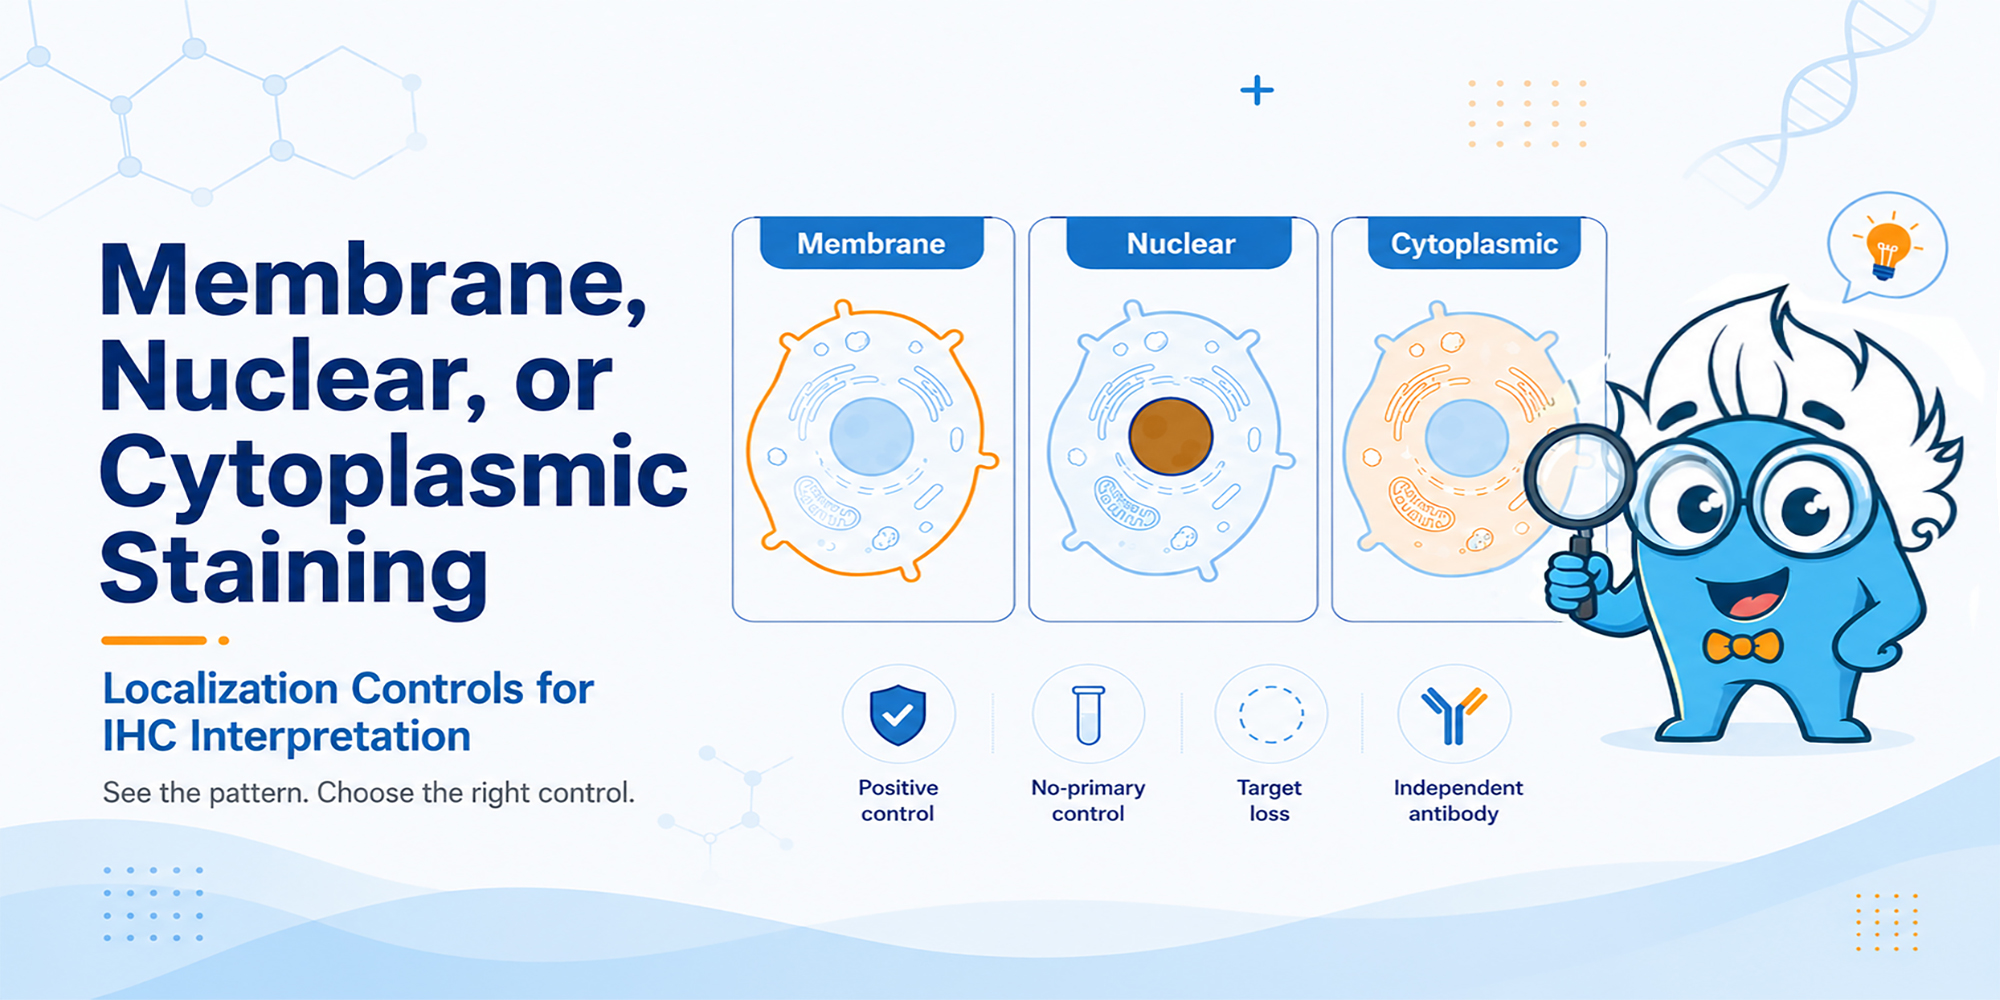
When an IHC signal appears in the wrong cellular compartment, localization is a warning sign—not a verdict on antibody specificity.
A membrane protein appears mostly cytoplasmic. A nuclear marker stains outside the nucleus. These patterns deserve attention, but they do not automatically mean the antibody is nonspecific. In fixed tissue, the observed signal reflects the biology of the sample, the antibody, and the assay conditions. [1,2]
The practical question is not simply whether the stain is in the expected place. It is what evidence can distinguish genuine localization from technical artifact or off-target binding. IHC staining localization controls are most useful when each one is chosen to answer a specific uncertainty.
Describe the staining before explaining i...
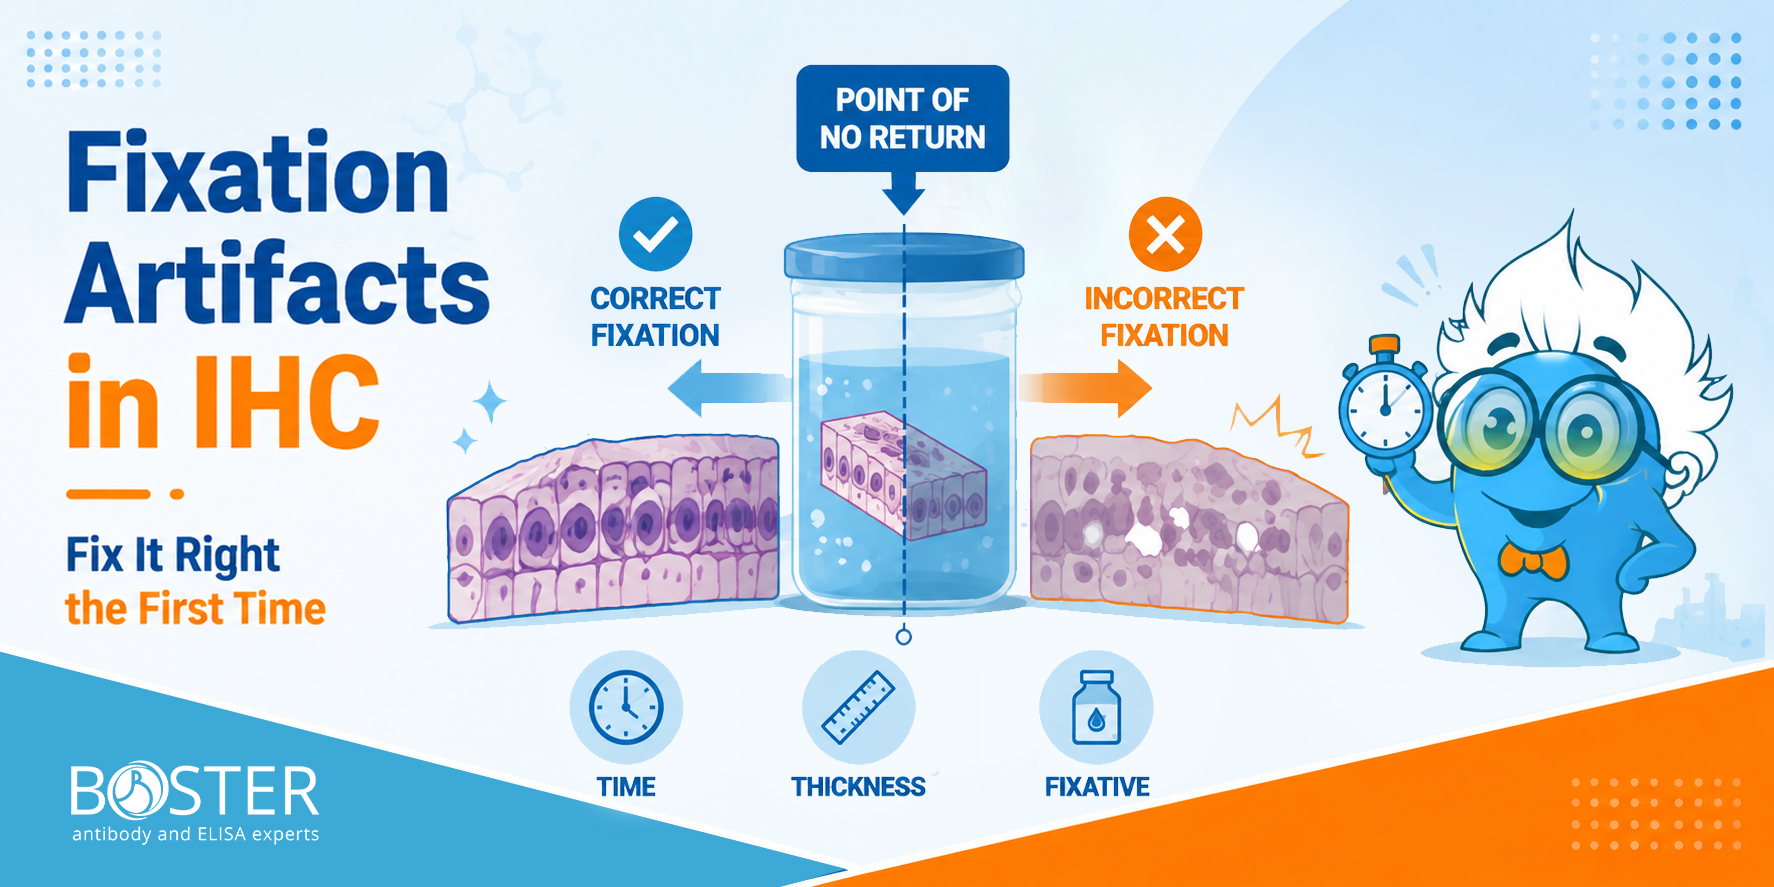
Fixation artifacts are difficult to reverse and may compromise IHC interpretation. Unlike most laboratory mistakes, poor tissue fixation cannot be corrected downstream. This guide covers every critical variable in the fixation workflow so your IHC biomarker data stays reliable across longitudinal studies.
A recombinant cytokine can be prepared at the correct calculated concentration and still produce a weaker-than-expected response after dilution or frozen storage. The protein may have lost biological integrity, but another explanation is often overlooked: part of the cytokine may no longer be in the liquid phase because it has adsorbed to tubes, pipette tips, or assay plates. This handling issue matters across many recombinant proteins, particularly when they are used at low concentrations in cell culture or functional assays.
Expression system, purification, and final formulation can influence how a recombinant protein behaves after reconstitution. Boster’s guide to recombinant protein production provides background on these upstream variables without replacing the handling instructions for the finished product.
In practice, a reduced experimental response after reconstitution can reflect two different problems:
A carrier protein can help with the first problem when it is compatible with the assay.
It cannot reliably repair a cytokine that has already aggregated or denatured.

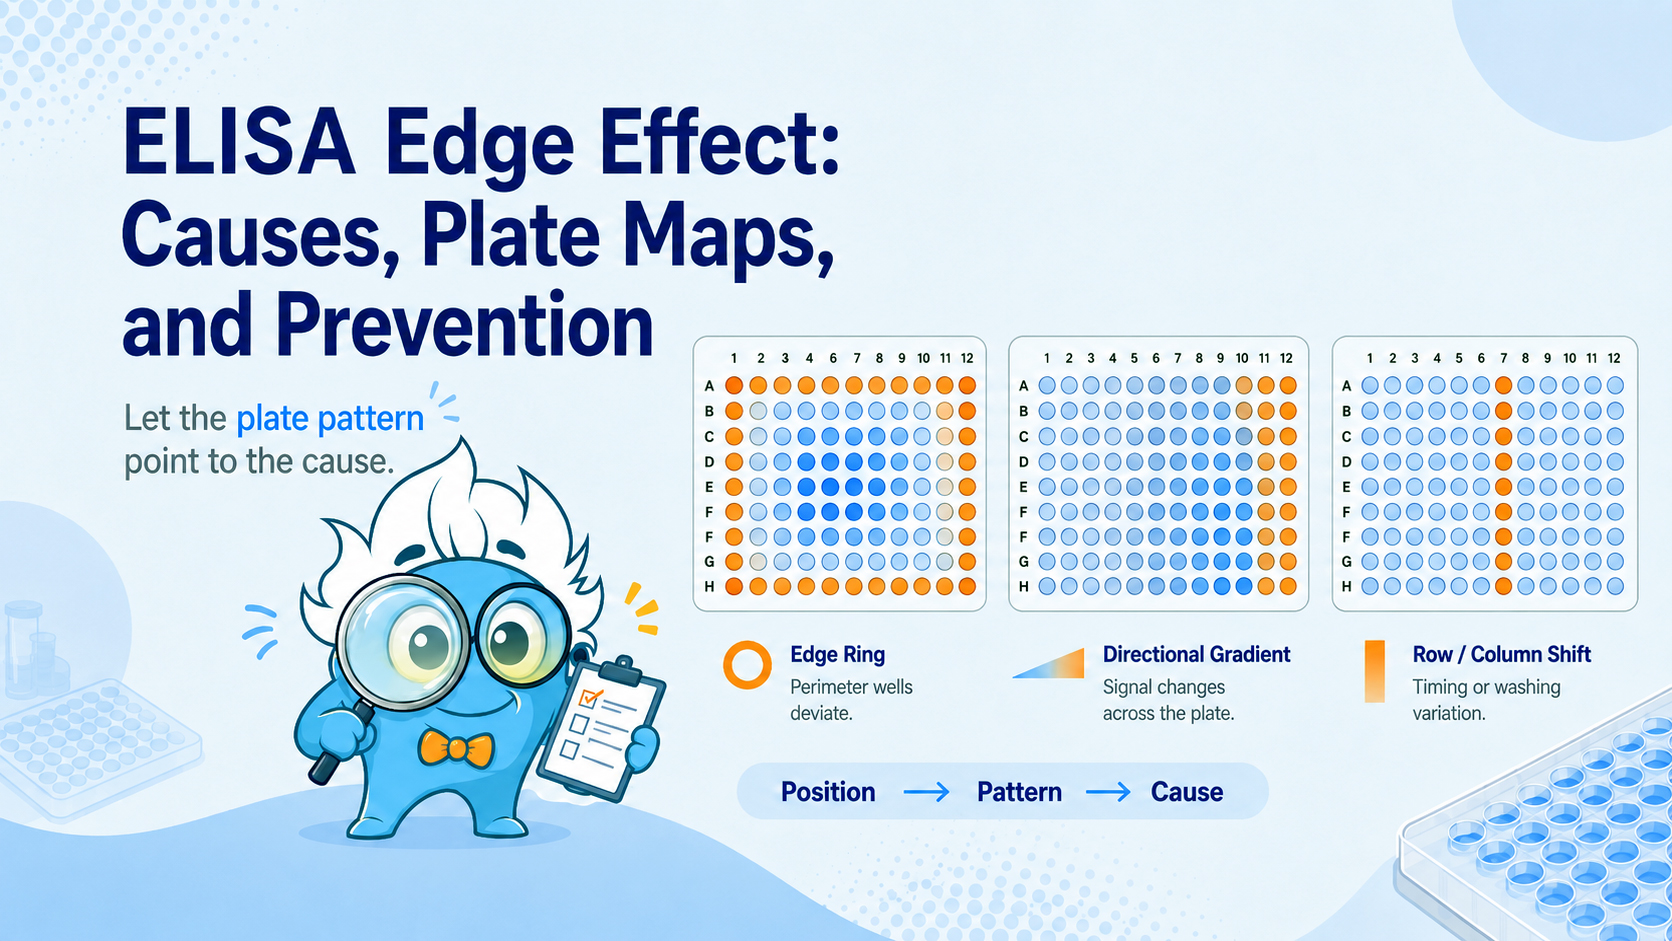
Why outer wells read high or low, how to recognize positional bias, and what to change before the next plate.
You finish an ELISA, review the optical density values, and notice that the outer wells do not behave like the center. Rows A and H may read higher, columns 1 and 12 may read lower, or the four corner wells may show the largest shift. The immediate question is whether the result reflects biology, evaporation, temperature, washing, dispensing order, or another plate-related artifact.
This position-dependent variation is commonly called the ELISA edge effect. It is not defined by one direction of change: outer wells can read either higher or lower than inner wells. The more useful clue is a repeatable spatial pattern that follows well position rather than sample identity. This guide explains how to recognize that pattern, distinguish it from other artifacts, test likely causes, design diagnostic plate maps, and reduce its impact on ELISA data.
Quick Answer
An ELISA edge effect is a systematic difference between peripheral and central wells. A complete outer ring, stronger corner deviations, or a repeatable edge-to-center gradient supports positional bias. High or low OD alone does not identify the cause; review the plate pattern and confirm it with controlled QC placement.
The clearest way to recognize an edge effect is to map raw OD values to their physical well positions before relying on calculated concentrations. Typical signs include:
The direction can vary by assay. Some plates show a high-OD perimeter, while others show lower edge values. Position dependence and reproducibility are more informative than the direction of the shift.
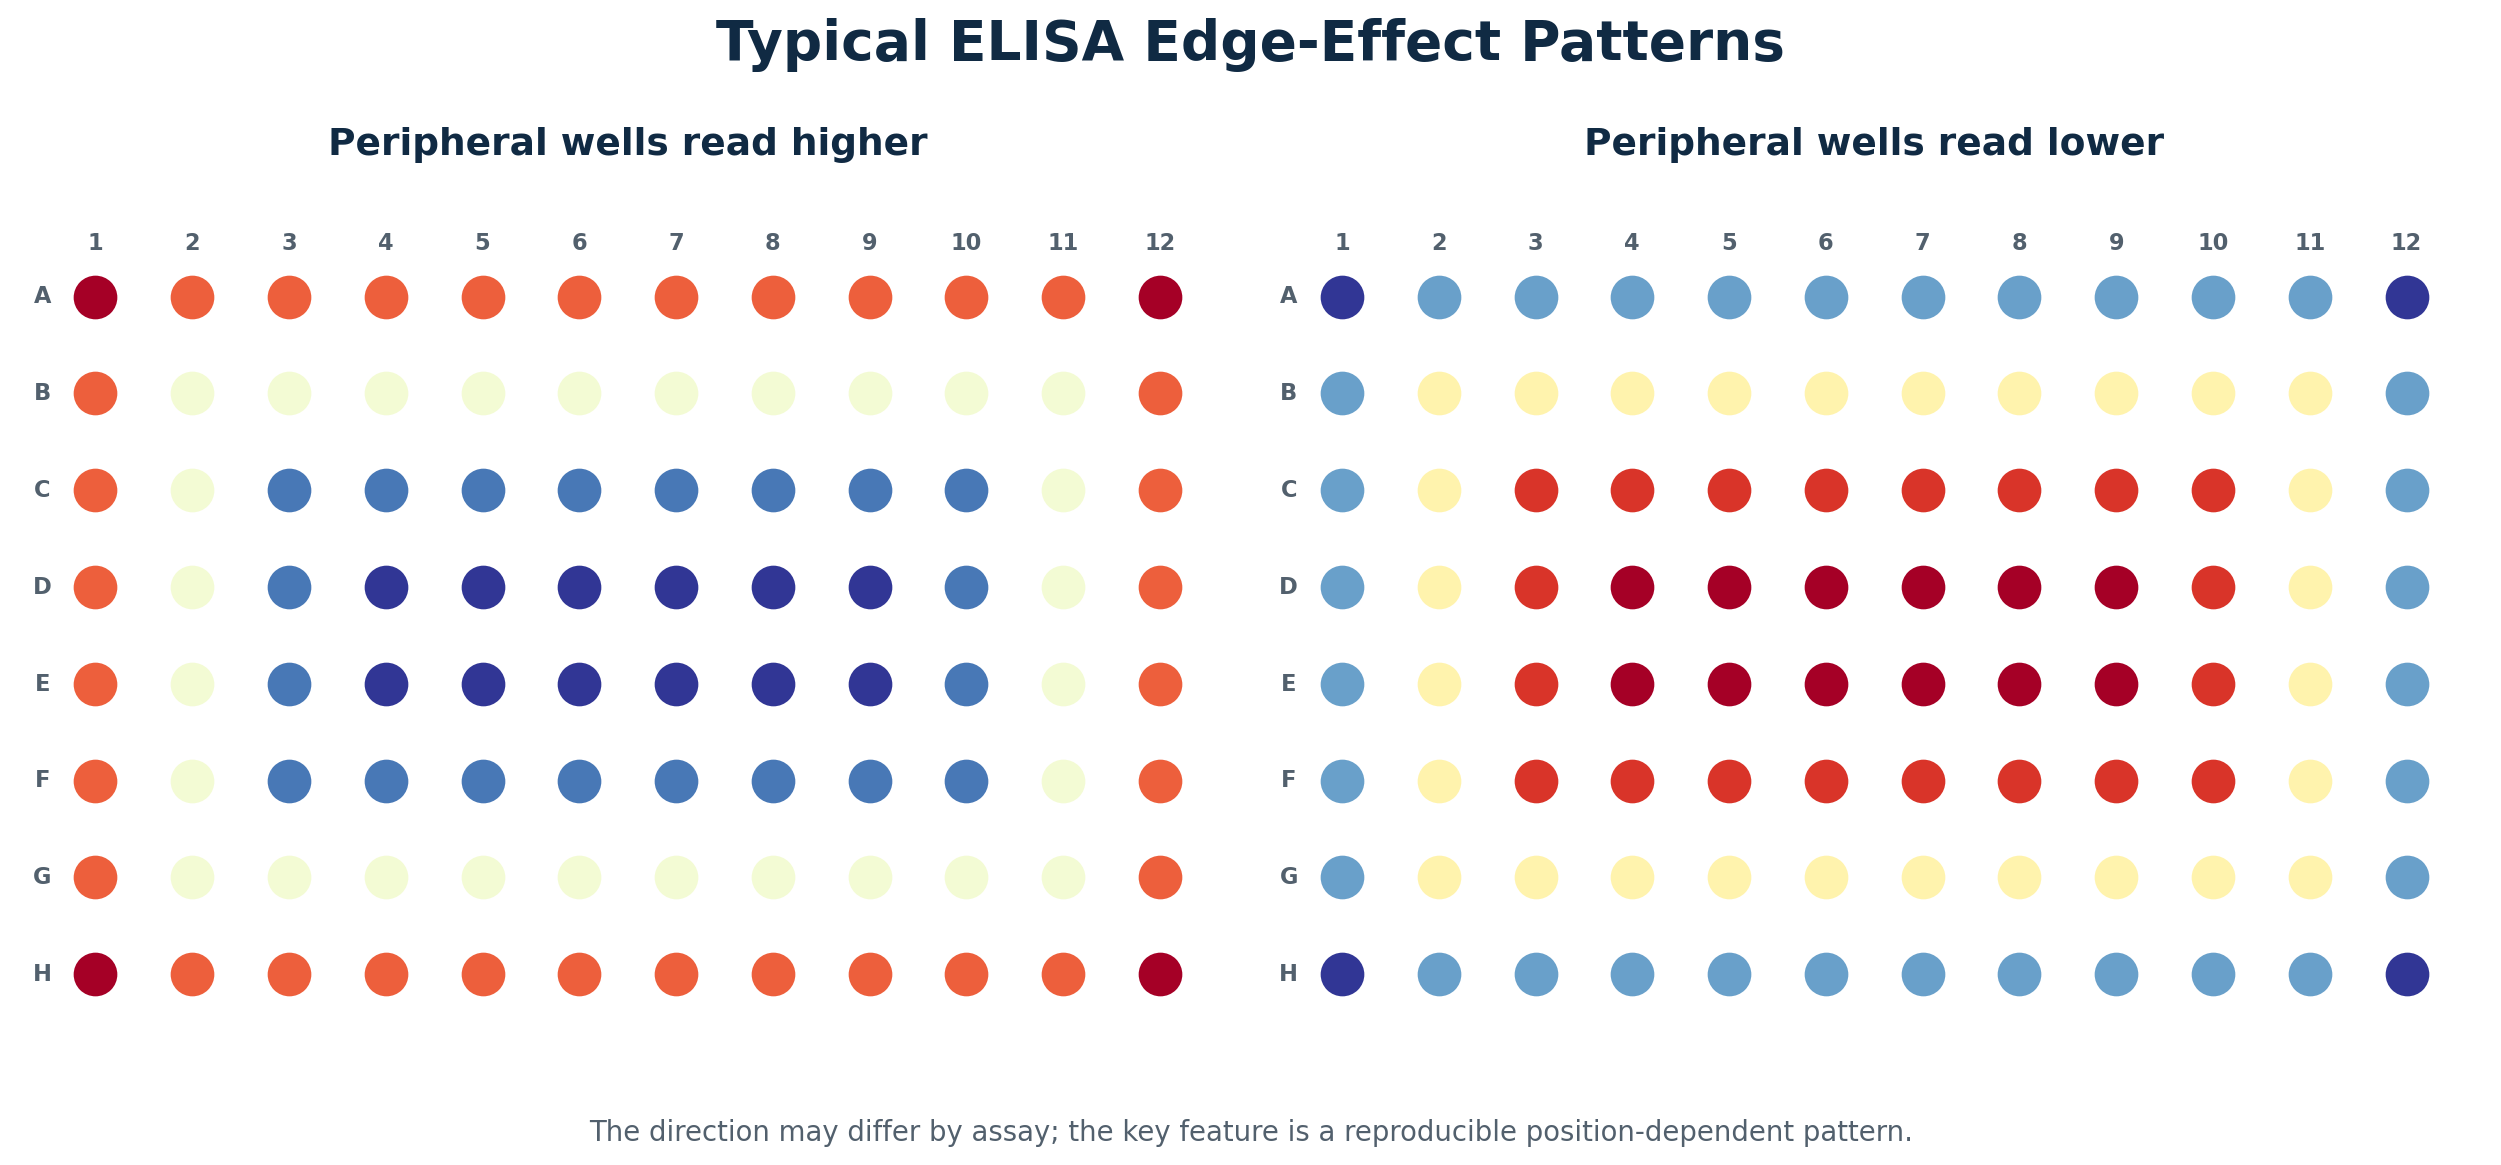
Figure 1. Typical high- and low-perimeter edge-effect patterns. The exact direction is assay-dependent; the diagnostic feature is a reproducible relationship with plate position.
Not every abnormal outer well is a classic edge effect. The spatial pattern often points to the step that should be investigated first.
| Pattern on the plate | More likely explanation |
|---|---|
| Complete perimeter ring, often strongest at corners | Temperature, evaporation, sealing, or plate-position effects |
| One side of the plate differs | Directional environmental exposure, incomplete sealing, or reader-related bias |
| Gradual left-to-right or top-to-bottom change | Dispensing, substrate, stop-solution, or reading-time drift |
| One entire row or column differs | Multichannel pipette or plate-washer issue |
| Irregular local cluster | Contamination, bubbles, splashing, or local washing problem |
| Scattered isolated wells | Pipetting error, bubbles, or particulate material |
| Same experimental group differs after randomized placement | Biological variation becomes more plausible |
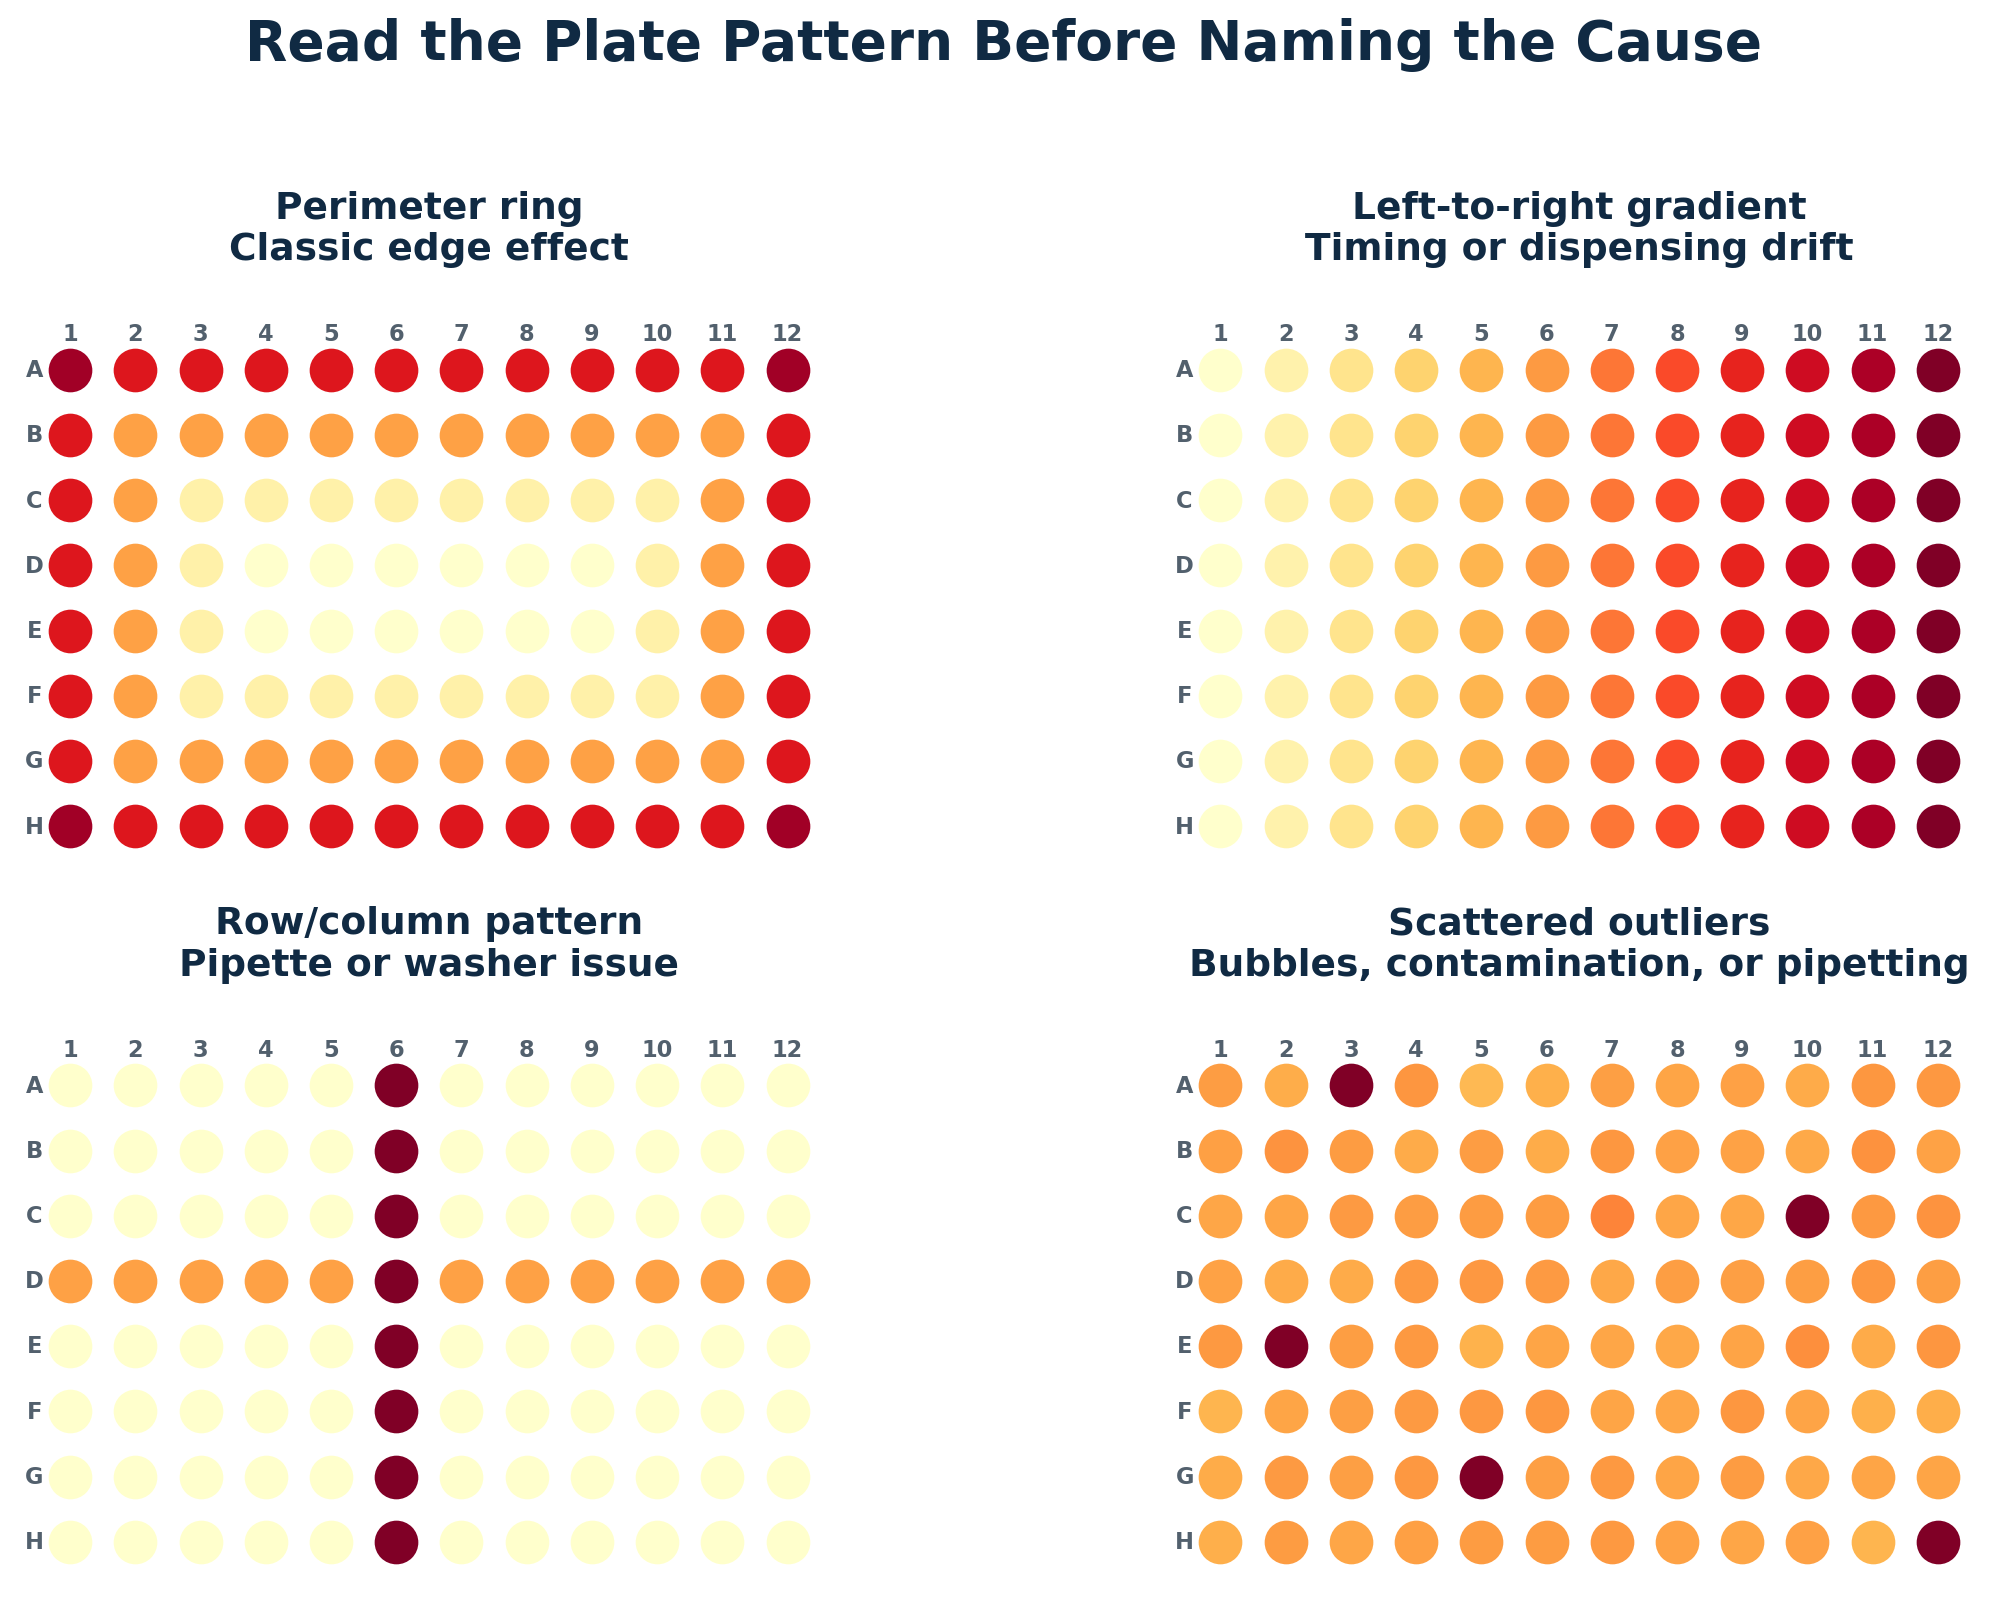
Figure 2. Four common plate patterns. A perimeter ring is different from directional timing drift, row/column artifacts, and scattered outliers.
For a broader checklist covering weak signal, high background, poor replicates, and inconsistent runs, use Boster Bio’s ELISA troubleshooting guide.
Several mechanisms can act at the same time. The dominant factor depends on assay format, incubation conditions, sealing, plate material, washing, and the stage at which the pattern develops.
A clean loading control band can still normalize the wrong thing. If the control is saturated, treatment-sensitive, or mismatched to the sample fraction, it can make a blot look corrected while quietly distorting the target result. In Western blotting, a reliable internal loading control should remain proportional to the amount of sample loaded and independent of changes in the protein of interest.
To choose a reliable Western blot loading control, define what variation you need to control: total protein loading, transfer efficiency, fraction recovery, or densitometry normalization. Selecting appropriate loading controls antibodies can help ensure the chosen reference is suitable for the type of variation being assessed. The control should be stable under the treatment, appropriate for the sample fraction, detected within the linear range, and processed under the same workflow as the target. GAPDH, beta-actin, and tubulin can work for routine total lysates, but they are not universal references. Across different experimental conditions, the selected reference should reflect technical variation without changing alongside protein expression or overall protein abundance.
A loading control is not just a band under the target. It is the reference used to argue that target differences are biological rather than technical. If that reference is unstable or overloaded, normalization can make weak data look stronger than it is. For a broader product starting point, Boster's Loading Control Antibodies page is useful, but the real decision still depends on the experiment. A sound Western blot analysis therefore requires evidence that the internal loading control is suitable for the sample type and treatment.
Most Western blot normalization relies on one assumption: the loading control changes because of technical variation, not because of the biology being tested. This means the internal loading control should remain stable even when the protein of interest and related protein levels respond to treatment.
That assumption is easy to violate. If a treatment lowers both the target protein and GAPDH, normalizing the target to GAPDH may underestimate the real target decrease. If the target is unchanged but beta-actin changes because the treatment affects cytoskeletal organization, normalization may create a false target difference. If the loading control is saturated, every lane can look equal even when loading differences remain. This concern is especially important when the control is a cytoskeletal protein or when the experiment examines signaling proteins that can alter cell structure or metabolism.
The question is not simply, “Do I have a loading control?” The better question is whether that control is allowed to behave as a reference in this experiment.
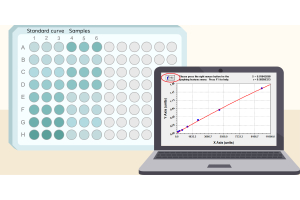
Different blots need different reference logic. In routine total lysate experiments, the main concern is usually lane-to-lane loading and transfer variation. A common housekeeping protein may be enough if it is stable and not saturated. Before loading, a protein assay should be performed against a standard curve so that comparable amounts of sample enter each lane.
Fractionated samples are different. A nuclear fraction needs a nuclear reference. A mitochondrial fraction needs a mitochondrial reference. A membrane-enriched sample should not be normalized blindly to a soluble cytoplasmic protein. Equal total protein loading does not always mean equal recovery of the compartment you care about. The internal loading control should match the subcellular localization of the fraction and should represent recovery of the compartment containing the target.
This is where mismatched controls become dangerous. Strong GAPDH signal in a nuclear fraction may be a contamination warning, not a loading control. A cytosolic control in a membrane prep may not reflect membrane protein recovery. Boster's Western Blot Antibody Selection Guide gives a useful overview of compartment-based antibody choices, but the key is to match the control to the technical question. For nuclear proteins, lamin B1 can serve as a nuclear reference when its stability has been validated. However, lamin B1 may change during apoptosis, senescence, or nuclear envelope disruption. For mitochondrial samples, a marker associated with the mitochondrial membrane may better reflect organelle recovery than a total lysate control.
GAPDH, beta-actin, and tubulin are popular because they are abundant and easy to detect. That convenience is also why they can mislead.
GAPDH is tied to glycolysis and can shift in metabolism, hypoxia, stress, and cell-state experiments. Beta-actin becomes risky when the study affects migration, differentiation, morphology, apoptosis, or the cytoskeleton. Tubulin needs caution in microtubule-drug, cell-cycle, neuronal, or differentiation models. In these settings, altered protein levels may reflect biology rather than loading variation.
Nuclear controls such as Histone H3, Lamin, or TBP are better suited to nuclear fractions, but they still need context. Apoptosis, chromatin remodeling, or nuclear envelope disruption can change what looks like a stable marker. Cell-cycle synchronization can also influence histone abundance during DNA replication. In studies focused on DNA replication, validate Histone H3 and other nuclear references before using them for normalization.
A housekeeping protein becomes a bad control the moment the experiment starts regulating it. Post-translational modifications can also change antibody recognition or apparent band migration, even when the amount of the reference protein has not changed.
One of the most common loading-control failures is not absence. It is saturation.
Housekeeping proteins are often so abundant that their bands become too strong before the target is detected well. A clean, dark GAPDH or beta-actin band may look reassuring, but if the signal has plateaued, it no longer reflects protein amount. A saturated loading control cannot correct loading differences. It only makes different lanes look more equal than they are. For quantitative Western blot analysis, the internal loading control and the target must both remain within a response range where signal intensity tracks protein levels.
A simple warning sign is that shorter exposure or lower sample loa...

How to separate heat-related effects from contact problems, over-transfer, and membrane-selection errors.
You start a 90-minute wet transfer with cold buffer and...

A practical old-versus-new lot comparison that moves from experimental setup to a documented pass, conditional pass, or fail decision.
ANTIBODY LOT BRIDGING SERIES
Western Blot Worked Example — Use this article to see the cross-application requalification framework applied to one semi-quantitative W

A cross-application, risk-based workflow for comparing antibody lots and protecting data continuity across Western blot, IHC/IF, flow cytometry, and ELISA.
ANTIBODY LOT BRIDGING SERIES
Cross-Application Guide — Use this article for the overall requalification framework. A separate worked example applies the framework specifically to Western blot.
Estimated reading time: 7–9 minutes

Treatment decisions in oncology now rely on biomarker-defined pathways that enable more precise and targeted care. Immunohistochemistry (IHC) plays a central role in this shift, serving as a practical and clinically actionable method for linking tumor biology to therapy selection. A well-executed IHC Service supports this process by delivering validated, reproducible protein expression data derived from tissue samples that clinicians and researchers can use with confidence when making critical decisions in cancer diagnostics and molecular diagnostics.
IHC evaluates protein biomarkers directly within tissue architecture, allowing clinicians to assess not only whether a target is present, but also how it is distributed across each tissue section and surrounding cells. This spatial context is essential when determining therapeutic response, especially for targeted therapies and immunotherapies. As a result, IHC therapeutic decision-making is now integrated across clinical workflows, translational studies, and drug development programs within modern molecular biology and cancer diagnosis.
IHC therapeutic decision-making refers to the structured interpretation of protein-level biomarker data to guide treatment selection and clinical strategy. In this framework, IHC results are generated through validated immunohistochemical assays, where primary antibody binding to target antigens is followed by secondary antibody detection and signal amplification using optimized detection reagents such as DAB chromogen. These workflows are supported by standardized IHC staining protocols, including optimized Antigen Retrieval and Epitope Retrieval steps that ensure consistent antigen exposure.
These thresholds are directly linked to treatment eligibility, trial enrollment, and therapeutic pathways, supporting patient stratification in both routine care and clinical trial settings. Even small variations in staining intensity, background staining, or the proportion of positive cells can change classification outcomes. As highlighted in the source material, IHC findings frequently act as decision gatekeepers, where a single result determines whether a therapy pathway is accessible or excluded. This makes assay reproducibility, proper sample preparation, and control of tissue fixation methods such as formalin fixation critical for reliable decision-making.
Several IHC biomarkers are routinely used in oncology to guide therapeutic decisions, each supported by validated scoring systems and well-established clinical frameworks. These biomarkers are not interpreted in isolation; instead, they are integrated into treatment algorithms where expression levels directly determine eligibility for targeted therapies, immunotherapies, or hormone-based interventions. The accuracy of these markers is therefore critical, as even small...